How to Install Logstash on Ubuntu 18.04
Introduction
The ELK stack is a set of applications for retrieving and managing log files.
It is a collection of three open-source tools, Elasticsearch, Kibana, and Logstash. The stack can be further upgraded with Beats, a lightweight plugin for aggregating data from different data streams.
In this tutorial, learn how to install the ELK software stack on Ubuntu 18.04 / 20.04.

Prerequisites
- A Linux system running Ubuntu 20.04 or 18.04
- Access to a terminal window/command line (Search > Terminal)
- A user account with sudo orrootprivileges
- Java version 8 or 11 (required for Logstash)
Step 1: Install Dependencies
Install Java
The ELK stack requires Java 8 to be installed. Some components are compatible with Java 9, but not Logstash.
Note: To check your Java version, enter the following:
java -version The output you are looking for is 1.8.x_xxx.That would indicate that Java 8 is installed.
If you already have Java 8 installed, skip to Install Nginx.
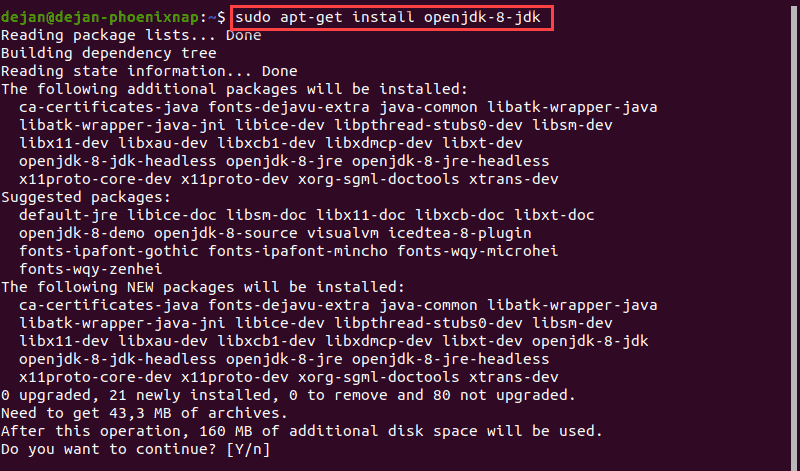
1. If you don't have Java 8 installed, install it by opening a terminal window and entering the following:
sudo apt-get install openjdk-8-jdk 2. If prompted, type y and hit Enterfor the process to finish.
Install Nginx
Nginx works as a web server and proxy server. It's used to configure password-controlled access to the Kibana dashboard.
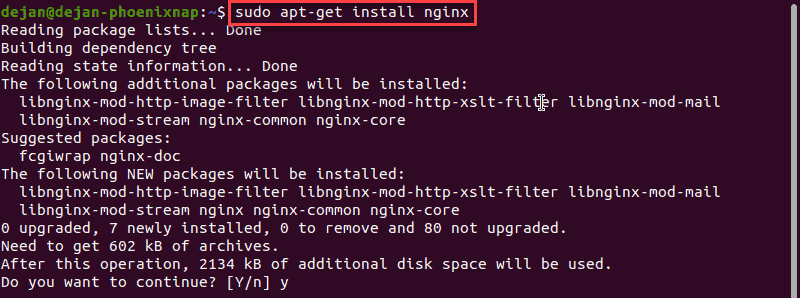
1. Install Nginx by entering the following:
sudo apt-get install nginx 2. If prompted, type y and hit Enter for the process to finish.
Step 2: Add Elastic Repository
Elastic repositories enable access to all the open-source software in the ELK stack. To add them, start by importing the GPG key.
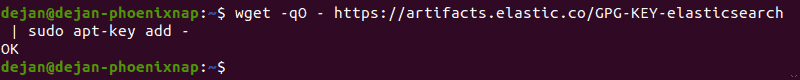
1. Enter the following into a terminal window to import the PGP key for Elastic:
wget -qO - https://artifacts.elastic.co/GPG-KEY-elasticsearch | sudo apt-key add - 2. The system should respond with OK, as seen in the image below.
3. Next, install the apt-transport-https package:
sudo apt-get install apt-transport-https 4. Add the Elastic repository to your system's repository list:
echo "deb https://artifacts.elastic.co/packages/7.x/apt stable main" | sudo tee –a /etc/apt/sources.list.d/elastic-7.x.list 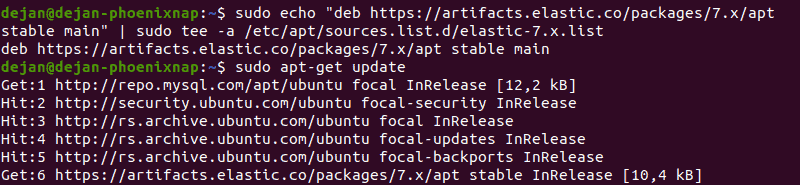
Step 3: Install Elasticsearch
1. Prior to installing Elasticsearch, update the repositories by entering:
sudo apt-get update 2. Install Elasticsearch with the following command:
sudo apt-get install elasticsearch 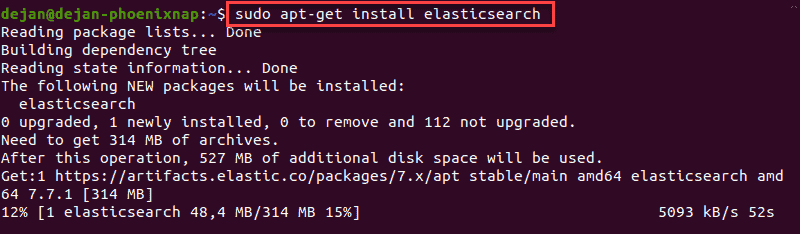
Configure Elasticsearch
1. Elasticsearch uses a configuration file to control how it behaves. Open the configuration file for editing in a text editor of your choice. We will be using nano:
sudo nano /etc/elasticsearch/elasticsearch.yml 2. You should see a configuration file with several different entries and descriptions. Scroll down to find the following entries:
#network.host: 192.168.0.1 #http.port: 9200 3. Uncomment the lines by deleting the hash ( # ) sign at the beginning of both lines and replace 192.168.0.1 with localhost .
It should read:
network.host: localhost http.port: 9200 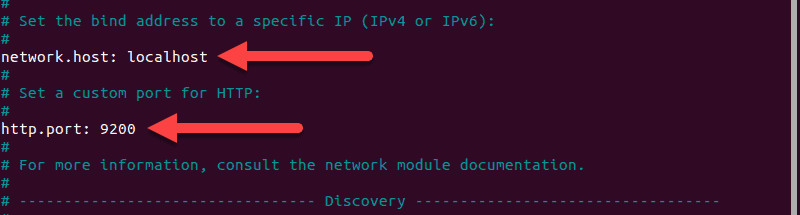
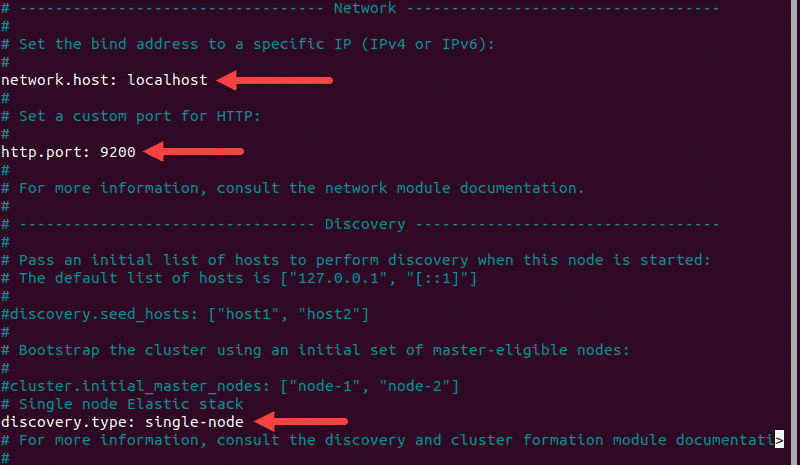
4. Just below, find the Discovery section. We are adding one more line, as we are configuring a single node cluster:
discovery.type: single-node For further details, see the image below.
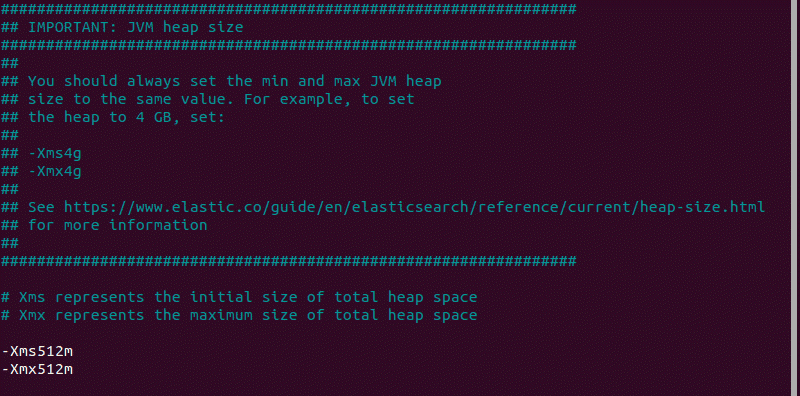
5. By default, JVM heap size is set at 1GB. We recommend setting it to no more than half the size of your total memory. Open the following file for editing:
sudo nano /etc/elasticsearch/jvm.options 6. Find the lines starting with -Xms and -Xmx . In the example below, the maximum ( -Xmx ) and minimum ( -Xms ) size is set to 512MB.
Start Elasticsearch
1. Start the Elasticsearch service by running a systemctl command:
sudo systemctl start elasticsearch.service It may take some time for the system to start the service. There will be no output if successful.
2. Enable Elasticsearch to start on boot:
sudo systemctl enable elasticsearch.service 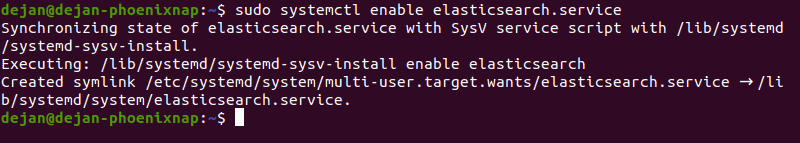
Test Elasticsearch
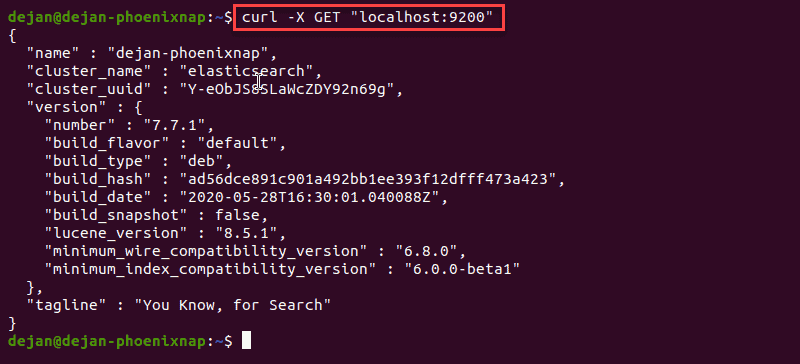
Use the curl command to test your configuration. Enter the following:
curl -X GET "localhost:9200" The name of your system should display, and elasticsearch for the cluster name. This indicates that Elasticsearch is functional and is listening on port 9200.
Step 4: Install Kibana
It is recommended to install Kibana next. Kibana is a graphical user interface for parsing and interpreting collected log files.
1. Run the following command to install Kibana:
sudo apt-get install kibana 2. Allow the process to finish. Once finished, it's time to configure Kibana.
Configure Kibana
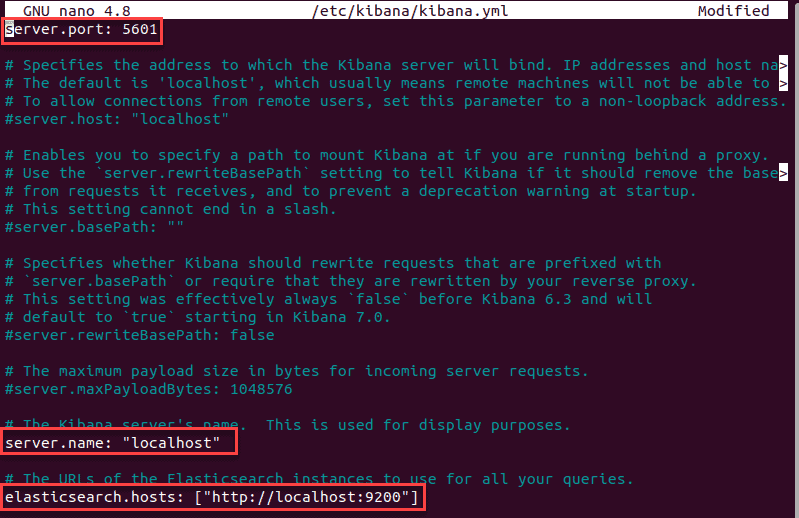
1. Next, open the kibana.yml configuration file for editing:
sudo nano /etc/kibana/kibana.yml 2. Delete the # sign at the beginning of the following lines to activate them:
#server.port: 5601 #server.host: "your-hostname" #elasticsearch.hosts: ["http://localhost:9200"] The above-mentioned lines should look as follows:
server.port: 5601 server.host: "localhost" elasticsearch.hosts: ["http://localhost:9200"] 3. Save the file (Ctrl+ o ) and exit (Ctrl+x ).
Note: This configuration allows traffic from the same system Elasticstack is configured on. You can set the server.host value to the address of a remote server.
Start and Enable Kibana
1. Start the Kibana service:
sudo systemctl start kibana There is no output if the service starts successfully.
2. Next, configure Kibana to launch at boot:
sudo systemctl enable kibana 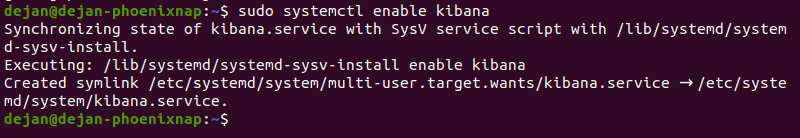
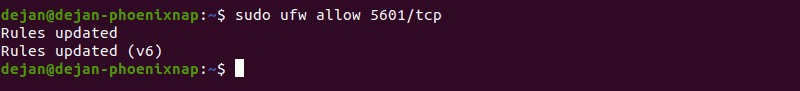
Allow Traffic on Port 5601
If the UFW firewall is enabled on your Ubuntu system, you need to allow traffic on port 5601to access the Kibana dashboard.
In a terminal window, run the following command:
sudo ufw allow 5601/tcp The following output should display:
Test Kibana
To access Kibana, open a web browser and browse to the following address:
http://localhost:5601 The Kibana dashboard loads.
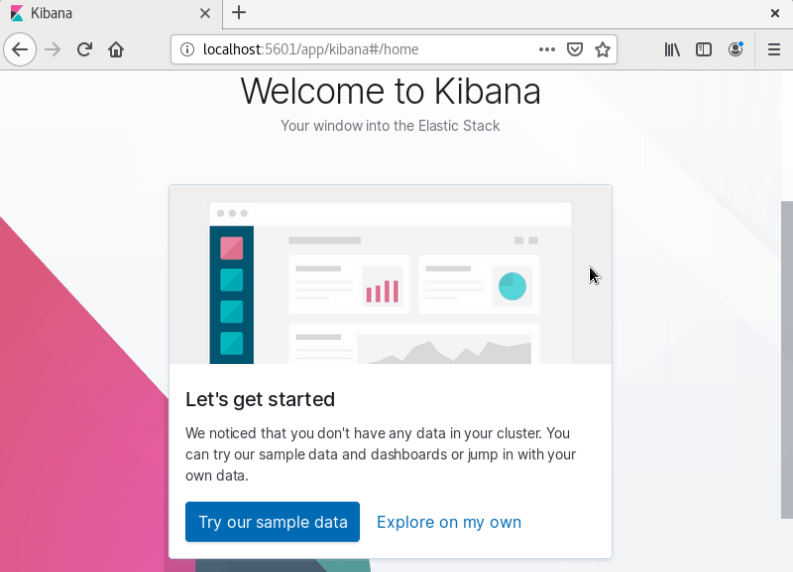
If you receive a"Kibana server not ready yet" error, check if the Elasticsearch and Kibana services are active.
Note: Check out our in-depth Kibana tutorial to learn everything you need to know visualization and data query.
Step 5: Install Logstash
Logstash is a tool that collects data from different sources. The data it collects is parsed by Kibana and stored in Elasticsearch.
Install Logstash by running the following command:
sudo apt-get install logstash Start and Enable Logstash
1. Start the Logstash service:
sudo systemctl start logstash 2. Enable the Logstash service:
sudo systemctl enable logstash 3. To check the status of the service, run the following command:
sudo systemctl status logstash 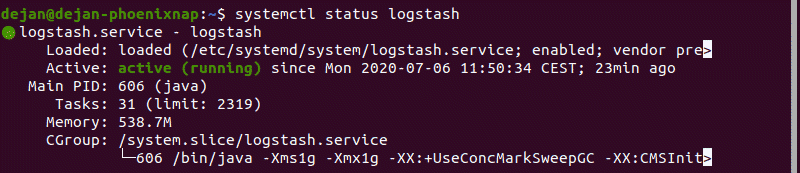
Configure Logstash
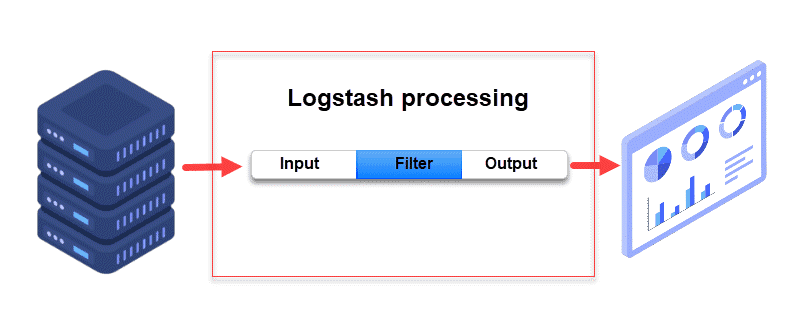
Logstash is a highly customizable part of the ELK stack. Once installed, configure its INPUT, FILTERS, and OUTPUT pipelines according to your own individual use case.
All custom Logstash configuration files are stored in /etc/logstash/conf.d/ .
Step 6: Install Filebeat
Filebeat is a lightweight plugin used to collect and ship log files. It is the most commonly used Beats module. One of Filebeat's major advantages is that it slows down its pace if the Logstash service is overwhelmed with data.
Install Filebeat by running the following command:
sudo apt-get install filebeat Let the installation complete.
Note: Make sure that the Kibana service is up and running during the installation and configuration procedure.
Configure Filebeat
Filebeat, by default, sends data to Elasticsearch. Filebeat can also be configured to send event data to Logstash.
1. To configure this, edit the filebeat.yml configuration file:
sudo nano /etc/filebeat/filebeat.yml 2. Under the Elasticsearch output section, comment out the following lines:
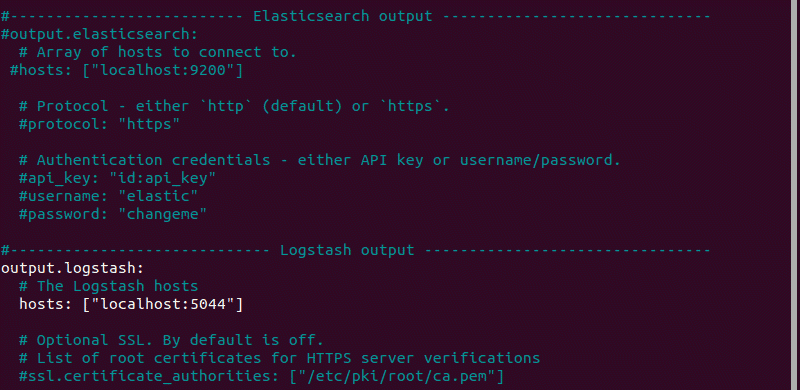
# output.elasticsearch: # Array of hosts to connect to. # hosts: ["localhost:9200"] 3. Under the Logstash output section, remove the hash sign ( # ) in the following two lines:
# output.logstash # hosts: ["localhost:5044"] It should look like this:
output.logstash hosts: ["localhost:5044"] For further details, see the image below.
4. Next, enable the Filebeat system module, which will examine local system logs:
sudo filebeat modules enable system The output should read Enabled system .
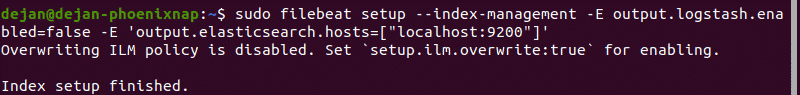
5. Next, load the index template:
sudo filebeat setup --index-management -E output.logstash.enabled=false -E 'output.elasticsearch.hosts=["localhost:9200"]' The system will do some work, scanning your system and connecting to your Kibana dashboard.
Start and Enable Filebeat
Start and enable the Filebeat service:
sudo systemctl start filebeat sudo systemctl enable filebeat Verify Elasticsearch Reception of Data
Finally, verify if Filebeat is shipping log files to Logstash for processing. Once processed, data is sent to Elasticsearch.
curl -XGET http://localhost:9200/_cat/indices?v 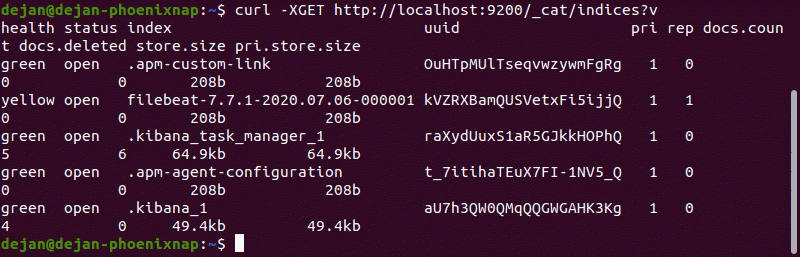
Conclusion
Now you have a functional ELK stack installed on your Ubuntu system. We recommend defining your requirements and start adjusting ELK for your needs. This powerful monitoring tool can be customized for individual use cases.
Customize data streams with Logstash, use different Beats modules to gather various types of data, and utilize Kibana for easy browsing through log files.
Read our comprehensive Tutorial on ELK Stack to learn more.
Was this article helpful?
Yes No
How to Install Logstash on Ubuntu 18.04
Source: https://phoenixnap.com/kb/how-to-install-elk-stack-on-ubuntu